The InstaEssay Archive: Past, Present, and Future
Note: I will be presenting a more formalized version of this work at the Keystone DH conference at Penn this summer, and the purpose of this post is to show a work in progress. Already in the hours since posting it, I've heard from some of the authors discussed here that there may be some problems with my data and/or analysis. Most glaringly, an unescaped character is breaking my Instagram scraper for the user @ruddyroye and thus his full body of work is not represented. I will be correcting this ASAP, and I'm grateful to Ruddy Roye for pointing this out.
1. Prologue: What is an InstaEssay?
Beginning in April, 2014, a number of writers began to utilize Instagram beyond its common use as an application that enables the creation, stylizing, and sharing of personal photographs to a particular group of friends, acquaintances, and followers, and rather as a journalistic tool. In particular, writers like Jeff Sharlet and Neil Shea have paired their photos with short narratives, constrained to 2200 characters by Instagram’s caption limit. The effect is similar to that of “Flash Fiction”—short, impactful self-contained stories—except that these stories are true and paired with a photograph of the subject. While the genre is called by a number of different names, most people refer to the form as “InstaEssays.”
A variety of media outlets have begun to pick up on this trend and locate it within the scope of literary journalism. The website “Longreads,” which typically collects and syndicates long form reporting and essays, collected Sharlet’s #nightshift series and included an essay by Sharlet on the work. There he refers to InstaEssays as “Snapshot Journalism” and locates its lineage within the frame of comic books, which use words and pictures, and snapshots, which, he points out anyone can take. Sharlet concludes his essay by noting, “It’s not the news. It’s not journalism in any conventional sense. It’s, Look at this! It’s, I saw these people, and I wanted you to see them, too.”
I wrote a blog post titled “Instagram Essay Introduction” in November, 2014, and included several embedded examples of the genre. It is available here.
2. Getting Started: Launching The InstaEssay Archive with Omeka
In the fall of 2014, my first semester as a PhD student in the English department at Northeastern University, I enrolled in Professor Ryan Cordell’s introduction to Digital Humanities course titled Texts, Maps, and Networks. The course included a reading component in which we were exposed to some fundamental texts in the field of Digital Humanities, but it also had a practice component in which we had the opportunity to become acquainted with some of the most commonly used DH tools. Among the tools we were introduced to were TEI, Gephi, Omeka, and Neatline. For the Omeka lesson, we were encouraged to think of some data we might want to compile into an archive.
Around that same time, I became aware of the emerging genre of InstaEssays. It seemed to me at the time that InstaEssays would make for the perfect data to be archived as part of my introduction to Omeka for a number of reasons. First, the amount of data that had been produced up to that point was still rather minimal, and thus manageable. Next, though Instagram appears to be a relatively stable social media platform, there is always the risk that either the platform itself would disappear or that the users who are using it to create InstaEssays might close down their accounts and take their posts with them. Finally, Instagram is built in such a way that it privileges its mobile app over its website. That is, unless you’re using the app on the phone, the ability to easily browse and, especially, search the platform are severely limited.
With these motivations—as well as the need to produce a functioning Omeka archive in fulfillment of the assignment—I set up an Omeka site and manually added a few InstaEssay posts. This was the first iteration of what would become The InstaEssay Archive. Even beginning with such a small data set, a number of problems presented themselves. Omeka uses the Dublin Core standard for metadata, which is quite comprehensive, but it was necessary to determine how to categorize the metadata related to the Instagram posts. For example, each item in the Omeka archive needs a title, but Instagram posts do not have titles. Additionally, there is a limited set of categories from which to choose when adding an item to Omeka. Are InstaEssays texts or images primarily? It was clear that in my role as archivist I was going to have to make a number of decisions about the nature of my data.
Beyond these considerations awaited the biggest challenge: how to efficiently gather the data to add to the collection. While my initial demo site included only five items, when I decided to continue this work and expand it into my final project for Professor Cordell's course, I needed a way to determine which posts should be included and then collect hundreds of Instagram posts into a database that I could upload to Omeka using its CSV import functionality. The problem of what posts to include has remained a constant throughout the development of this project, but at the beginning I simply hand selected posts by users that I knew to be working within the form. I assembled a number of different available web-based tools to assist in the process of gathering Instagram posts and, when these tools reached their limitations, I simply resorted to manual data entry.
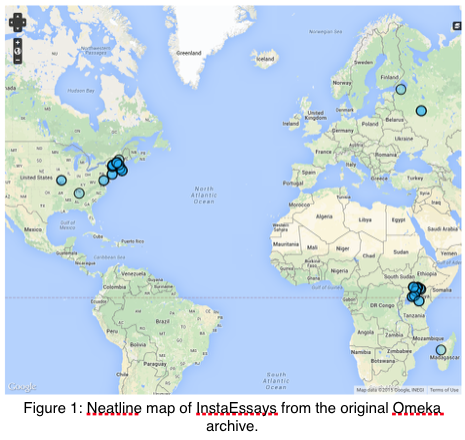
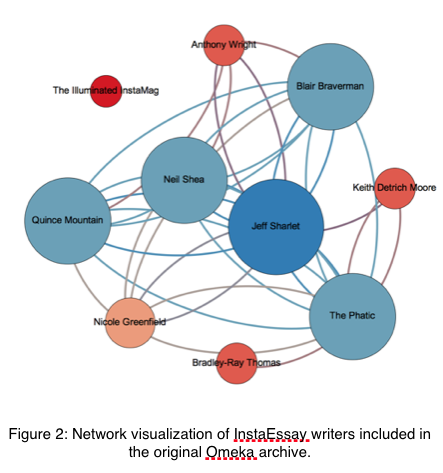
The first version of the InstaEssay Archive went live at www.instaessayarchive.org on December 11, 2014. It was far from perfect, but it was a start. In addition to the collection of items, I also created a map of those posts that included geographic data and a timeline using Neatline, as well as a very basic network visualization—created with Gephi—showing the relationships on Instagram of the writers whose work I included in the archive.
In the month that followed I only updated the site once, including new posts I had gathered in that time, but the process was, again, laborious and imperfect. I might have left this project to languish had it not been for a new course, which I began in the spring semester of 2015, Professor Benjamin Schmidt’s Humanities Data Analysis course. If Professor Cordell’s Texts, Maps, and Networks was a kind of introduction to DH, Professor Schmidt’s class was the next progressive step. It was in that course that I learned a new set of tools for working with data, which ultimately revived the InstaEssay Archive project. The narrative of what I learned in that course and the new tools I applied will make up the bulk of this essay. The problems I set out to solve include a method for more efficiently collecting InstaEssays, a means to find additional InstaEssays for inclusion from the vast sea of media that is Instagram, and assembling a set of tools for meaningful analysis of the data.
3. Learning R: Archiving and Analyzing
The first several weeks of Professor Schmidt’s course were dedicated to familiarizing myself with R, a programming language with which I had no previous experience, and R Studio a software package designed for coding in R. In those initial lessons, the class learned how to work with regular expressions, clean data, create visualizations, read in texts, and perform basic non-quantitive digital analysis. Over spring break, we were tasked with finding our own data to work with in R. By this point in the semester I saw the great opportunity that working in R would provide for further exploring my InstaEssay data. Beyond simply archiving, which, I’ve tried to make clear was already wrought with its own challenges, I now had the opportunity to simultaneously perform analysis on the data as I gathered it. This distinguishes the project from many other archival projects, which seek to assemble data for scholars to work on at a later date, as well as other data analysis projects, which typically work with data that has already been compiled and made available for research.
The first task I faced was finding a more efficient way to collect data from Instagram as I had become keenly aware that the data I had gathered for the initial iteration of The InstaEssay Archive was deeply flawed. For example, one of the writers I included in that first version informed me that I had mismatched her photos with another writers’ captions.
Early in the semester in Humanities Data Analsysis, we discussed possible means of gathering data and one of the options presented was scraping data from the internet where that was technically possible and legally permissable. Over spring break I began to research how I might accomplish this using R. I came across a blog post by Julian Hill at r-bloggers.com titled “Analyze Instagram with R” in which the process of registering an application with Instagram’s API, getting post data for a particular Instagram user, and performing some initial analysis and visualization of that data is detailed. I followed Hill’s directions to register the InstaEssay Archive with Instagram, and, after a few missteps, was able to connect R Studio to Instagram and begin pulling down data.
Instagram lists 20 posts per page on its website and uses Javascript to dynamically load the following page and next 20 posts. This means that when requesting posts from a user’s page, only 20 are downloaded at once. However, Instagram’s API also provides pagination information as part of the data. With Professor Schmidt’s help, I was able to modify Hill’s code by creating a function that would request the following page in a loop until no further pages were available, as indicated by the absence of data in the Next URL field.
I ran this function individually on each Instagram user from my initial set—as well as a few others that I had become aware of in the months since I launched the archive—and in a matter of seconds was able to gather every post they had ever created with the assurance that the information was accurate as it came directly from the source. Before I even began to perform analysis on the data, I replaced all of the items in my Omeka site with the new data. This, in itself was a vast improvement afforded me by working with R. From there, however, the real fun began as I turned my attention to analysis.
4. Analyzing InstaEssays: Initial Questions
Once I had collected this initial data, there were a number of goals that seemed within my reach. These goals aligned with some of the initials problems I encountered in setting up the archive. For example, I wanted the archive to not just be a collection of InstaEssays, but in some way to also tell the story of how the genre developed and continued to grow. In my first iteration of the InstaEssay Archive, I attempted to accomplish this by creating the timeline and map using Neatline. Analyzing the data in R, however, opened up new ways to tell this story.
Additionally, one of the greatest challenges from the outset was how to find new posts to include in the archive. I began with a set of users who I knew were working in the genre, but I knew that there were others doing similar work. One possibility for finding these new writers that never worked as well as I’d hoped was searching by hashtags that are often used in InstaEssays. However, to date there is not one hashtag in common use. Rather, there are several that writers use but that are also used by other Instagram users not working in this genre. Finally, I was interested in determining whether there were certain stylistic conventions associated with the genre.
5. Telling the Story: Over Time, Space, and Popularity
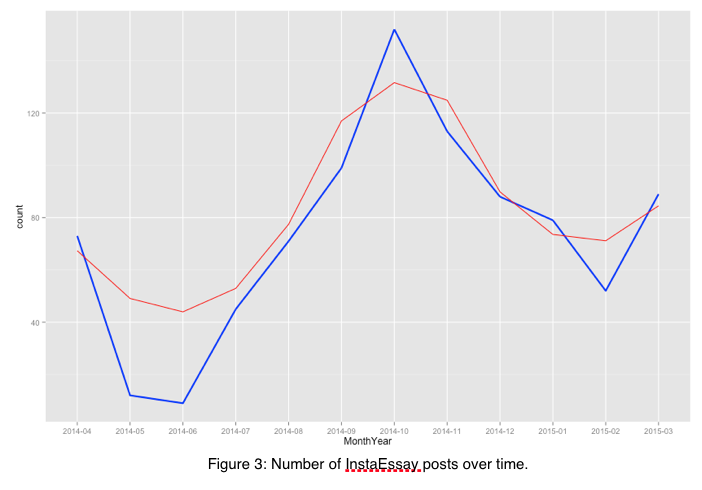
There are a few ways to visualize the story of the birth of the genre of InstaEssays. The first, is to show the number of posts over time, as in figure 3, which ranges from April, 2014, to March, 2015.
To create this visualization, I combined the posts I had gathered from the users I identified as consistently working within the genre and then grouped them by month and year. I performed a count on the number of posts per month and then plotted that over time. According to this graph, the genre was born in April, 2014, when nearly 80 posts were published. As it turns out, these were almost all created by Neil Shea, who was on assignment for National Geographic in East Africa when he began writing in the genre. (Correction: I had initially surmised that Shea launched the genre, but he informed me that Ruddy Roye had been working in this format before him.) Another interesting thing that this graph shows is that InstaEssays peaked in number in October, 2014. By this point, Jeff Sharlet had begun posting and was gaining media attention for his work. Coincidentally, this is also the month in which I began the process of archiving the genre.
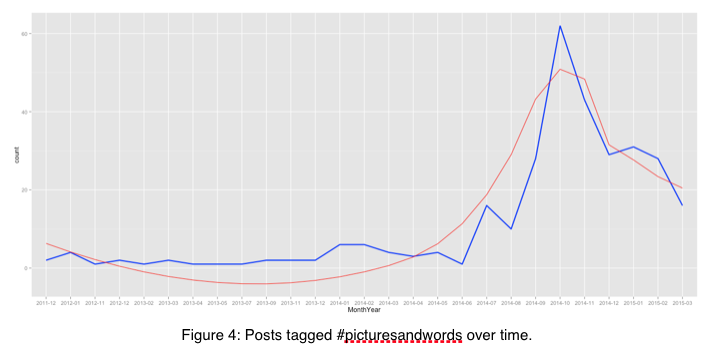
I also experimented with showing the usage of particular hashtags associated with the genre over time, although, as I noted there is not at this point a common hashtag that all InstaEssay writers use, nor is there a hashtag used only by these writers. Thus, while the line in figure 4, which shows posts tagged #picturesandwords over time, corresponds in some ways with the one in figure 3—it too reaches its zenith in October, 2014—it includes more than just InstaEssays, and thus dates back to before April, 2014.
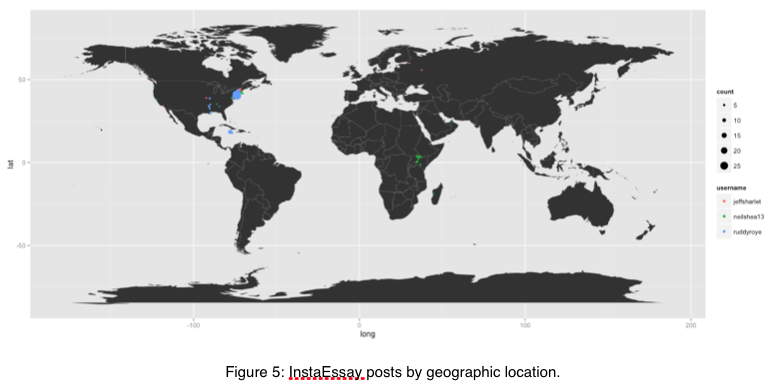
Another interesting way to visualize the spread of InstaEssays is to use the geographical data that some—but not all—Instagram users include in their posts. I initially accomplished this in the first iteration of the archive using Neatline, which is helpful in that the map it creates is interactive—users can hover over a point on the map and see the post it represents. But I wanted to recreate this using the cleaner data in R. Another benefit of mapping the posts in R is that I could set the size of each point to represent the number of posts assigned to a particular location. The map that resulted from these initial attempts is not as attractive as the map created in Neatline—though at present this represents a limitation in my map making skills using R as opposed to an inherent limitation in R.
Thought it’s difficult to see in figure 5, the three users in my database that tag their Instagram posts with geographic data are Jeff Sharlet (jeffsharlet), Neil Shea (neilshea13), and Ruddy Roye (ruddyroye). Most of Sharlet’s posts originate in the northeastern United States, near his home. Though, he also has written some posts from the Midwest as well as from Russia. Neil Shea also writes from the Northeast, but there is a cluster of posts in East Africa as well. Ruddy Roye works primarily in New York City, but also has a number of posts that seem to track along the Mississippi River. Each of these writers is from the United States, but there stories are international in nature.
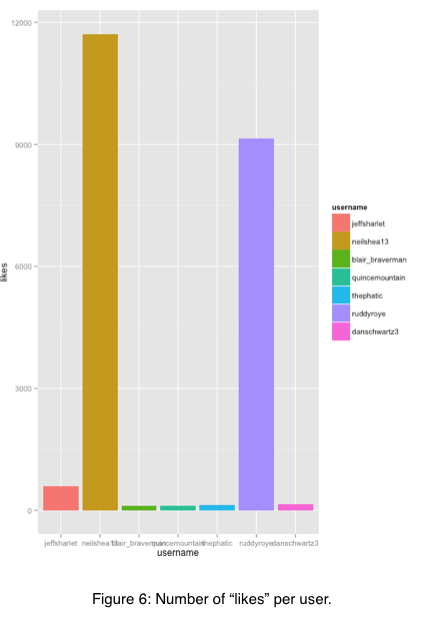
Finally, one benefit of gathering posts directly from Instagram is that in addition to the metadata I had included in my mostly manually gathered initial database, I now have more information I can work with including comments and “likes” for each post. This data allows me to visualize the popularity of each writer working in the genre (figure 6).
Clearly, Neil Shea has amassed the most likes on his posts—even considering the fact that he has been at this longer—with Ruddy Roye relatively not far behind. The next most popular is Jeff Sharlet, Dan Schwartz, and then Randy Potts (thephatic).
6. Seeking New Writers: Principle Component Analysis and Classifying
While it is interesting to perform this kind of analysis on the data I had collected, I have been aware throughout the process that these posts represent only a fraction of potential InstaEssays on Instagram. It is unclear just how big a fraction this is—I have no doubt that Jeff Sharlet and Neil Shea, in particular, represent the core of InstaEssay writers—but my goal is to present a more comprehensive picture of the genre. In order to accomplish this goal, I needed to know a number of things about the posts I had already collected. For example, is there something distinctive about the genre that could be detected by analyzing the texts of the posts in my database? To begin to answer this question I turned to Principle Component Analysis (PCA). Matthew Jockers, in his book Macroanalysis, defines PCA as “a method of condensing multiple features into ‘principle components,’ components that represent, somewhat closely, but not perfectly, the amount of variance in the data.”
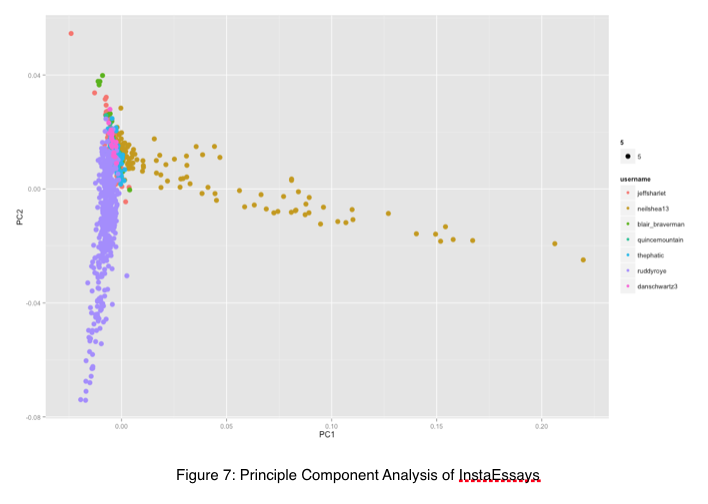
Performing PCA on the posts by the authors I knew to be working in the genre showed that while there are some variations, particularly in the work of Neil Shea and Ruddy Roye, most posts do cluster together.
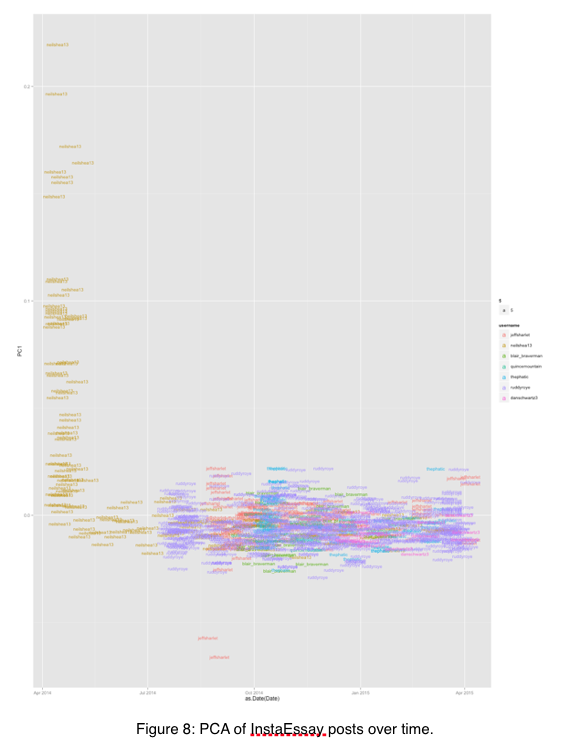
Figure 7 represents the top two principle components, PC1 and PC2. After seeing this, I wondered what I might learn from seeing PC1 charted over time. Figure 8 resulted, and helped me understand a bit better what the outliers might mean.
There are a couple interesting things to note here. The first is that when PC2 is removed, the variation associated with Ruddy Roye disappears, which is to be expected since figure 7 shows that his variation existed in PC2. But, even more interesting is the way that, over time, Neil Shea’s posts begin to conform to the rest. In looking into this more closely, it turns out—as noted before—that initially Shea was reporting from East Africa and much of what distinguishes his earlier posts from the later ones is actually the content. All in all, visualizing the data in this way gave me the sense that perhaps there are enough commonalities in the InstaEssays I had collected to be able to expand my reach based on these posts.
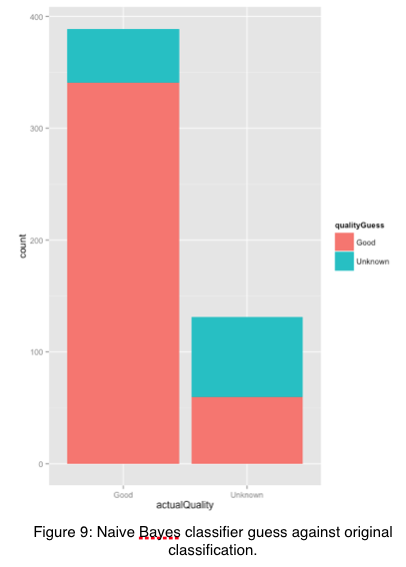
In order to accomplish this, I turned to classification, particularly a Naive Bayes classifier. This uses word frequencies to determine if a text belongs to one category or another. For my purposes, I created two categories. The first, based on the data I already knew to be InstaEssays, I simply labeled “Good.” Then, I collected all Instagram posts that use the hashtag #picturesandwords, which is commonly used in InstaEssays, but also in a lot of other, non-InstaEssay posts. These, I called “Unknown.” I ran the Naive Bayes classifier in an effort to determine if, based on my “Good” set, I could find other candidates for “Good” among the “Unknown.” To my great delight, it seems to have worked. This isn’t particularly easy to visualize, but when I created a new data frame to show only posts that had previously been part of the “Unknown” set and, based on Naive Bayes were predicted to be “Good,” I ended up with 51 posts, many of which (but not all) are indeed InstaEssays.
In an effort to check my work, I created a visualization that would show the computer’s guesses in each category. Figure 9 shows that the vast majority of posts that I had labeled “Good” were also guessed to be “Good” by the classifier. And, of those I had determined to be “Unknown,” a little less than half were deemed “Good.”
More so than directing me to individual posts for inclusion, however, this proved to be most helpful in identifying users that I might want to look into for inclusion in the archive. I created a new data frame that included only the names of users who had at least one post labeled as “Good,” and determined that there are 37 users that I should look at more closely. I can perform this same kind of classification on other commonly used hashtags and perhaps even on a wider set of Instagram posts.
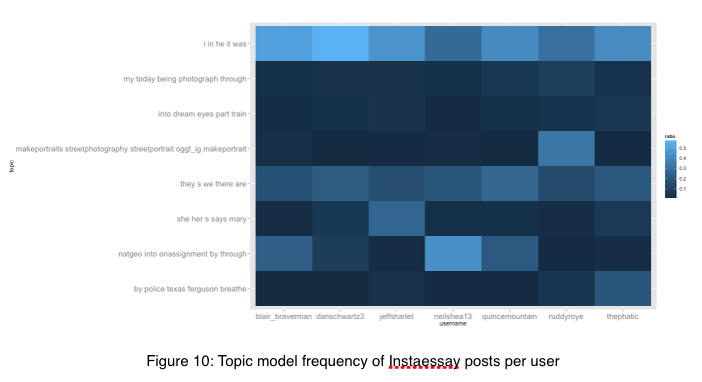
One final, and not particularly enlightening analysis I performed on the data that I had available was an attempt at topic modeling—a means of determining what these texts are about. Figure 10 shows the frequency of 8 “topics,” actually just groups of words, by username. With a bit of extrapolation, it does a fine job of indicating what each of the writers most often write about. For example, Jeff Sharlet wrote a long series of posts on a woman named Mary Mazur, and sure enough the topic most aligned with him includes the words “she,” “her,” “says,” and “mary.” Randy Potts (thephatic) reported on the recent protests in Ferguson, Missouri, and, as such, the topic that most aligns with him includes the words “police,” “ferguson,” and “breathe.”
7. Where Do We Go From Here: Further Questions and Considerations
As my main goal as an archivist of InstaEssays is to more efficiently and effectively gather relevant posts for inclusion in the archive, this process has proven quite successful. At the very least, being able to scrape Instagram for relevant posts and easily convert that data into a CSV for uploading to Omeka is a huge step in the right direction. Additionally, seeing as how to date there is still not a universally used hashtag that would indicate to me that a particular Instagram post is an InstaEssay, using classification to identify new posts and users for potential inclusion is extremely helpful.
But even as I continue to gather data, new questions arise. Above I showed the ability to determine a user’s popularity on Instagram based on the number of likes his or her posts amassed. I would like to dig further into this data, however, to perhaps consider what, in particular, makes a post popular. This may be possible by gathering the most popular posts and using PCA to find their commonalities. Another approach may be to topic model this subset of posts to determine if particular topics are more popular.
It is clear, at the end of this initial foray into working with R, that a combination of unsupervised analysis, like what I have detailed here, and more supervised analysis in which I comb through the results in an effort to determine the computer’s accuracy, is necessary. Additionally, I intend to streamline the process for scraping new posts from Instagram. Finally, a means of adding to my data frame without creating duplicates will be developed. At the start of this project, the problems I set out to solve included a method for more efficiently collecting InstaEssays, a means to find additional InstaEssays for inclusion from the vast sea of media that is Instagram, and assembling a set of tools for meaningful analysis of the data. While there is, of course, more to do, so far this has been a successful experiment.
If you liked this post, consider sharing it or follow me on Twitter.
